By Howie Fenton for RSA – There is a growing demand for a new feature in software called dashboards. These business dashboards are based on your car’s dashboard which shows the critical information you need to drive your car such as speed, fuel, oil, temperature, tire pressure etc.
 The growing interest in business dashboards became clear to me on a recent assignment with a State printer.
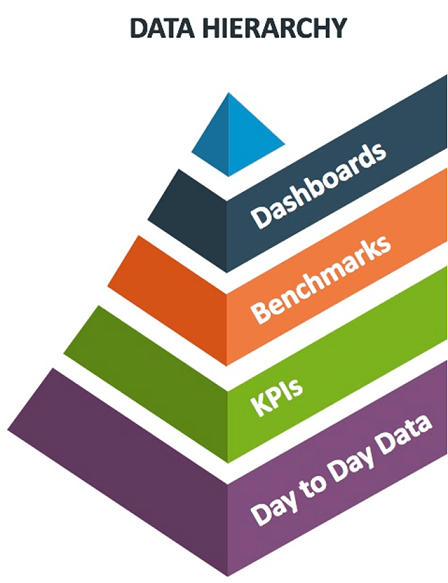
Ironically, the interest in business dashboards did not come from the in-plant staff but instead from upper management and other agencies with oversight responsibilities. Dashboards are typically more of a graphical display like a gauge in your car, and they can display day to day data, key performance indicators (KPIs) or benchmarks. In this article you will learn about trends from leading in-plants in using these three traditional metrics and the emerging trend for dashboards, as well.
Day to Day Data…
Click here to read the rest!
SOURCE Rochester Software Associates
Tips to Build a Data-driven In-plant: Critical Information to Collect